
Ionospheric conditions
GNSS Scintillation
Modern navigational systems that use radio-wave signals reflecting from or propagating through the ionosphere as a means of determining range, or distance, are vulnerable to a variety of effects that can degrade performance. In particular, systems such as the GNSS, that use constellations of earth-orbiting satellites, are affected by space weather phenomena. See Space Weather Effects on GPS. For a map of GNSS receivers see the Canadian Active Control System of Natural Resources Canada.
If the electron density along a signal path from a satellite to a receiver changes very rapidly, as a result of space weather disturbances, the resulting rapid change in the phase of the radio wave may cause difficulties for the GPS receiver, in the form of loss of lock. Temporary loss of lock results in cycle slip, a discontinuity in the phase of the signal. Very rapid variations (less than about 15 seconds) in the signal's strength and phase are known as ionospheric scintillations. Scintillations can be particularly troublesome for receivers that are making carrier-phase measurements and may result in inaccurate or no position information.
Natural Resources Canada collaborates with the CHAIN of the University of New Brunswick to collect information on GNSS scintillations. See the CHAIN Real-time Scintillation Map for current scintillation information. For more information please contact Dr. David Boteler.
HF Radio Propagation
HF radio relies on reflections from the ionosphere which can be impacted by space weather. The Sun emits electromagnetic radiation that spans a continuum of wavelengths from radio, through microwave, infrared, visible, ultraviolet x-ray and beyond. Ultraviolet radiation interacts with the upper atmosphere to form an ionized layer known as the ionosphere. Radio waves interact with the ionosphere in a variety of ways depending on their frequencies. For frequencies below about 30 MHz, the ionosphere can act as a reflector, and this property permits very long distance radio communications around the world. At higher frequencies, above 30 MHz, radio signals usually pass through the ionosphere.
The ionosphere sometimes becomes disturbed as a reaction to some types of solar activity and, as a result, radio wave propagation may be degraded or disrupted. Solar flares emit electromagnetic radiation, such as x-ray emissions which can cause increases in ionization in the lower ionosphere, with consequent phase shifts in low frequency radio signals and increased absorption (fading) in HF and VHF radio signals. The wide spectrum of radio noise emitted from a flare may interfere with a wanted radio signal. These effects may be experienced at all latitudes. At frequencies above 30 MHz, unexpected reflections of the radio waves by the ionosphere may cause radio interference.
Large clouds of plasma (ionized gases), known as CME, can be emitted from the Sun, and may reach Earth, causing disturbances in the geomagnetic field and in the ionosphere. Coronal holes, regions of the solar corona with diminished x-ray emissions, also emit streams of charged particles that can result in disturbances of the ionosphere. Ionospheric disturbances are especially significant at auroral latitudes, such as over much of Canada, and during magnetic storms and substorms at these latitudes, HF radio communication may be unreliable.
Solar phenomenon may be accompanied by streams of very energetic particles that travel at near the speed of light. These particles (mainly protons and electrons) enter the upper atmosphere in the regions near the magnetic poles. As a result, the lower levels of the polar ionosphere become very ionized, with severe absorption of HF and VHF radio signals. Such an event is known as a PCA event and may last for several days, depending on the strength of the stream of solar particles and the location of the source region on the Sun. HF radio communication in polar regions is often impossible during PCA events.
Natural Resources Canada operates a network of relative ionospheric opacity meters (riometers) distributed across Canada to monitor the impact of space weather on HF radio communication. The map and table below indicate the location of these riometers. For more information, or for riometer data please contact Dr. Robyn Fiori.
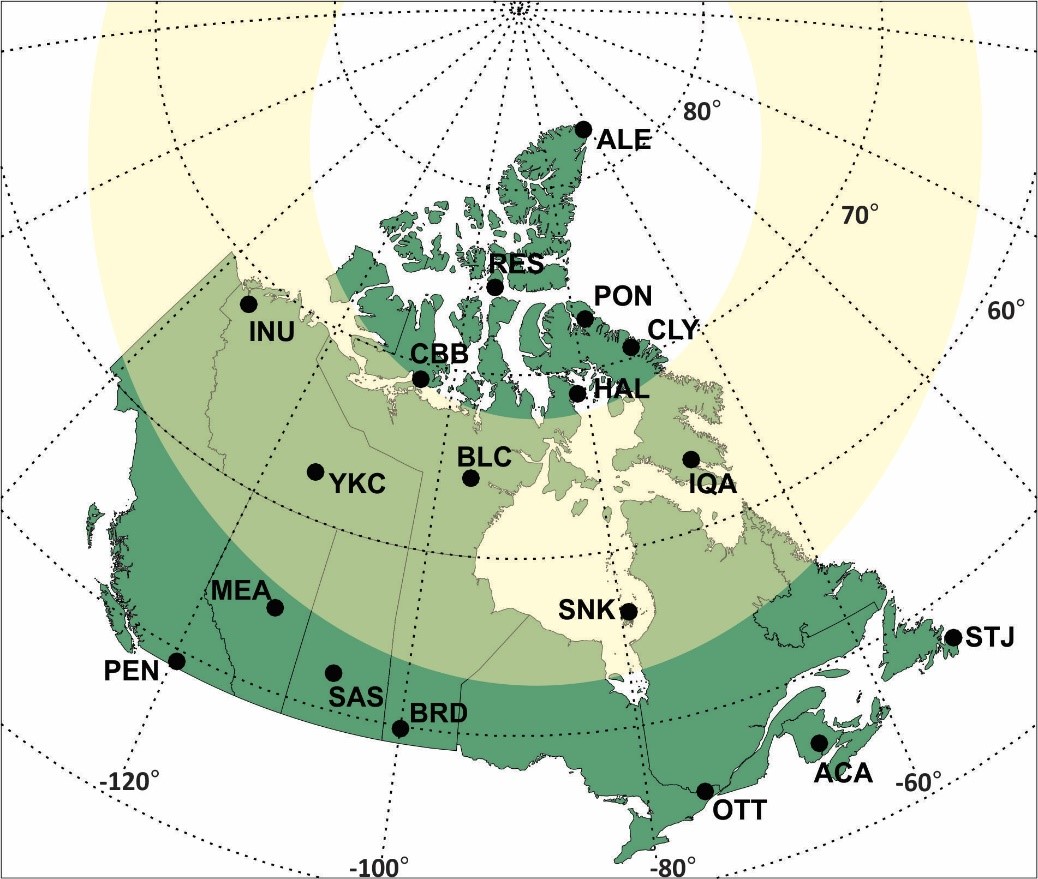
| Abbreviation | Name | Geographic Latitude (°N) |
Geographic Longitude (°E) |
|---|---|---|---|
| ACA | Acadia | 46.0 | 294.0 |
| ALE | Alert | 82.5 | 297.7 |
| BLC | Baker Lake | 64.3 | 264.0 |
| BRD | Brandon | 49.9 | 260.1 |
| CBB | Cambridge Bay | 69.1 | 255.0 |
| CLY | Clyde River | 70.5 | 291.5 |
| HAL | Hall Beach | 68.8 | 278.8 |
| INU | Inuvik | 68.3 | 226.5 |
| IQA | Iqaluit | 63.7 | 291.5 |
| MEA | Meanook | 54.6 | 246.7 |
| OTT | Ottawa | 45.4 | 284.5 |
| PEN | Penticton | 49.3 | 240.4 |
| PON | Pond Inlet | 72.7 | 282.1 |
| RES | Resolute Bay | 74.7 | 265.1 |
| SAS | Saskatoon | 52.2 | 252.9 |
| SNK | Sanikiluaq | 56.3 | 281.0 |
| STJ | St John's | 47.6 | 307.3 |
| YKC | Yellowknife | 62.5 | 245.5 |