
Regional magnetic conditions and forecasts
Regions
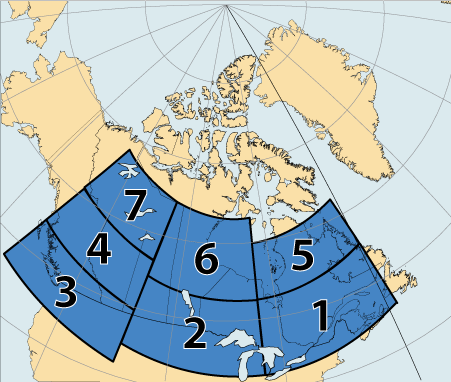
- Eastern North America
- Southern Prairies
- South Western Canada
- Northern Prairies
- Eastern Auroral
- Central Auroral
- Western Auroral
Information
Status Reports
The Reports for the several geographic regions are derived from actual measurements made at magnetic observatories situated in each of the regions. In each case, data are telemetered from the observatory to headquarters in Ottawa, where the data are processed to produce a Khr index to characterize the level of magnetic disturbance measured during the past hour.
For qualitative comparison, the words describing the activity levels used in other forecast formats in this web site are included. Colours in the display panels change according to the level of the magnetic activity and Khr index, ranging from blue, through green, yellow, red, to purple.
Regional Forecasts
The Forecasts are provided as summaries of the expected activity during the next 3 hours and during the following 3 hours, for each of the regions. Again, for ease of comparison with other sources of information, they are presented in terms of the Khr index. The forecasts are updated every fifteen minutes. The words describing the activity levels and the panel colour scheme used for the Status Reports also apply to the Forecast panels.
Khr Index
The Khr index is approximately equivalent to the local K index, but whereas the true K index is not routinely available until the day after data are measured, the Khr index is available almost immediately. The two indices can differ slightly at low levels of activity but are not significantly different at high levels of activity. There are nine levels in the Khr index, as in the K index. Whereas the K index is defined over an interval of 3 hours, the Khr index is defined over an interval of 1 hour. It is derived from the running hourly range computed from the incoming observatory data, and is equivalenced to the K scale.